US OCCUPATIONAL EXPOSURE BURDEN ESTIMATES, 2022: PSYCHOSOCIAL, PHYSICAL, & BIOLOGICAL
This interactive dataset examines the burden of psychosocial, physical, ergonomic, safety, and biological exposures in the United States (US) workforce. The dataset was created as part of a study conducted by researchers from the Department of Environmental and Occupational Health at the University of Washington, the Hazardous Waste Management Program in King County, and the Massachusetts College of Pharmacy and Health Sciences. The goals of the study were to understand the extent of workplace exposures in the US workforce, as well as who is most at risk, which is important for informing future interventions to improve worker health and reduce health inequities. To meet these goals, we merged 2022 US worker demographic data from the Current Population Survey (CPS) via the Employed Labor Force (ELF) query system with occupational survey information from the Occupational Information Network (O*NET). We additionally supplemented our analysis with data from the Occupational Employment and Wage Statistics (OEWS) survey and the CPS to characterize additional psychosocial exposures.
The dataset provides the estimated number and percent of workers either exposed or employed in occupations with exposure to the selected hazard(s) by sociodemographic group, as well as the estimated number and percent of workers either over- or underrepresented in exposure or over- or underrepresented in occupations with exposure to the selected hazard(s) by sociodemographic group. Estimates are provided at varying levels of occupational classification using the 2018 Census occupation code structure—as a sum across all occupations, by detailed occupation group, or by major occupation group. Exposure determinations, as well as the sociodemographic distribution, for specific occupations can be viewed in the EXPLORE BY OCCUPATION tab. See the ABOUT tab to learn more about the exposure definitions, study methods, study limitations, and other important definitions.
Explore the dataset as a table or figure by selecting the inputs below. You can view the generated table or figure by toggling between the tabs below.
INPUTS
Note: Other includes physical, ergonomic, safety, and biological exposures
TABLE SPECIFIC INPUTS
FIGURE SPECIFIC INPUTS
Download variable info Note. Employee counts are rounded to the nearest thousand, and percents are rounded to the nearest tenth. For all exposures except long work hours, the estimates reflect the percent of workers employed in occupations characterized by exposure to these hazards. For long work hours, the estimates reflect the percent of employees exposed to this hazard. Estimates provided for the race and ethnicity categories are non-mutually exclusive. Persons within each race category are of any ethnicity, except for persons who identify as non-Hispanic White, and persons of Hispanic/Latino ethnicity are also counted in their preferred race category. The category for racial and ethnic minoritized groups includes American Indian/Alaska Native, Asian, Black/African American, multiracial, Native Hawaiian/Pacific Islander, and Hispanic/Latino workers.
* = estimate was calculated from a sociodemographic population of <1000 workers (based on the unrounded value)
- = value is not applicable or not reported due to insufficient data or small sample size
Data Sources: Occupational characteristic data were obtained from the Occupational Information Network (O*NET) Resource Center and the Occupational Employement and Wage Statistics (OEWS) survey. US employment estimates, as well as estimates of workers who work long hours, were obtained from the CPS via the ELF query system.
Download Figure
Note. For all exposures except long work hours, the estimates reflect the percent of workers employed in occupations characterized by exposure to these hazards. For long work hours, the estimates reflect the percent of employees exposed to this hazard. Estimates provided for the race and ethnicity categories are non-mutually exclusive. Persons within each race category are of any ethnicity, except for persons who identify as non-Hispanic White, and persons of Hispanic/Latino ethnicity are also counted in their preferred race category. The category for racial and ethnic minoritized groups includes American Indian/Alaska Native, Asian, Black/African American, multiracial, Native Hawaiian/Pacific Islander, and Hispanic/Latino workers. AIAN = American Indian/Alaska Native, Black = Black/African American, NHPI = Native Hawaiian/Pacific Islander, White = non-Hispanic White, Hispanic = Hispanic/Latino, REM groups = racial and ethnic minoritized groups, <High school = Less than high school diploma or equivalent, High school = high school diploma or equivalent, Some college/associate = Some college or associate degree, ≥Bachelor's = Bachelor's or advanced degree
Data Sources: Occupational characteristic data were obtained from the Occupational Information Network (O*NET) Resource Center and the Occupational Employement and Wage Statistics (OEWS) survey. US employment estimates, as well as estimates of workers who work long hours, were obtained from the CPS via the ELF query system.
Citation: Stephan-Recaido S, Peckham T, Hawkins D, & Baker M. OCCUPATIONAL EXPOSURE BURDEN IN THE US, 2022 [Internet]. 2024. Available: LINK
Page last updated: 1 February 2024
US OCCUPATIONAL EXPOSURE BURDEN ESTIMATES, 2022: PSYCHOSOCIAL, PHYSICAL, & BIOLOGICAL
Here, you can explore information regarding the determination of exposures and the distribution of sociodemographic groups for specific occupations. Explore data from a single or multiple occupations by selecting the inputs below. Occupations are organized using the 2018 Census occupation code structure. See the ABOUT tab to learn more about the exposure definitions, the study methods, the study limitations, and other important definitions.
SELECT OCCUPATION(S)
ADDITIONAL INPUTS
EXPOSURE DETERMINATIONS BY OCCUPATION
The table below shows which hazards are considered exposures in the selected occupation(s). In this analysis, all workers employed in an occupation with a positive exposure determination are considered exposed — this is a limitation of our methods and data sources.
Note.
Values in the 'Exposed' column either indicate the yes/no binary exposure determination, or the percent estimated to be exposed.
Data Sources: Occupational characteristic data were obtained from the Occupational Information Network (O*NET) Resource Center and the Occupational Employement and Wage Statistics (OEWS) survey.
ADDITIONAL INPUTS
SOCIODEMOGRAPHIC DISTRIBUTION OF WORKERS BY OCCUPATION
The table below shows the number and percent of workers by sociodemographic group within the selected Census occupation code(s), in addition to the number and percent of workers over or underrepresented within the occupation(s).
Download variable info
Note.
Estimates provided for the race and ethnicity categories are non-mutually exclusive. Persons within each race category are of any ethnicity, except for persons who identify as non-Hispanic White, and persons of Hispanic/Latino ethnicity are also counted in their preferred race category. The category for racial and ethnic minoritized groups includes American Indian/Alaska Native, Asian, Black/African American, multiracial, Native Hawaiian/Pacific Islander, and Hispanic/Latino workers.
* = estimate was calculated from a sociodemographic population of <1000 workers (based on the unrounded value)
- = value is not applicable or not reported due to insufficient data or small sample size
Red/positive (+) value = overrepresented (i.e., the number workers is in excess of the expected based on the group’s share of the total workforce) and are highlighted in red
Negative (-) value = underrepresented (i.e., the number of workers is under the expected
Data Sources: US employment estimates were obtained from the Current Population Survey (CPS) via the Employed Labor Force (ELF) query system.
Citation: Stephan-Recaido S, Peckham T, Hawkins D, & Baker M. OCCUPATIONAL EXPOSURE BURDEN, 2022 [Internet]. 2024. Available: LINK
Page last updated: 1 February 2024
US OCCUPATIONAL EXPOSURE BURDEN ESTIMATES, 2022: PSYCHOSOCIAL, PHYSICAL, & BIOLOGICAL
View additional tables and figures of the dataset using the tabs below.
AVERAGE US EMPLOYMENT ESTIMATES BY SOCIODEMOGRAPHIC GROUP: 2022 CURRENT POPULATION SURVEY
Data source: US employment estimates were obtained from the Current Population Survey (CPS) via the Employed Labor Force (ELF) query system.
RELATIVE PERCENT OF US WORKERS OVER- OR UNDERREPRESENTED IN EXPOSURE BURDEN BY HAZARD AND SOCIODEMOGRAPHIC GROUP, 2022.
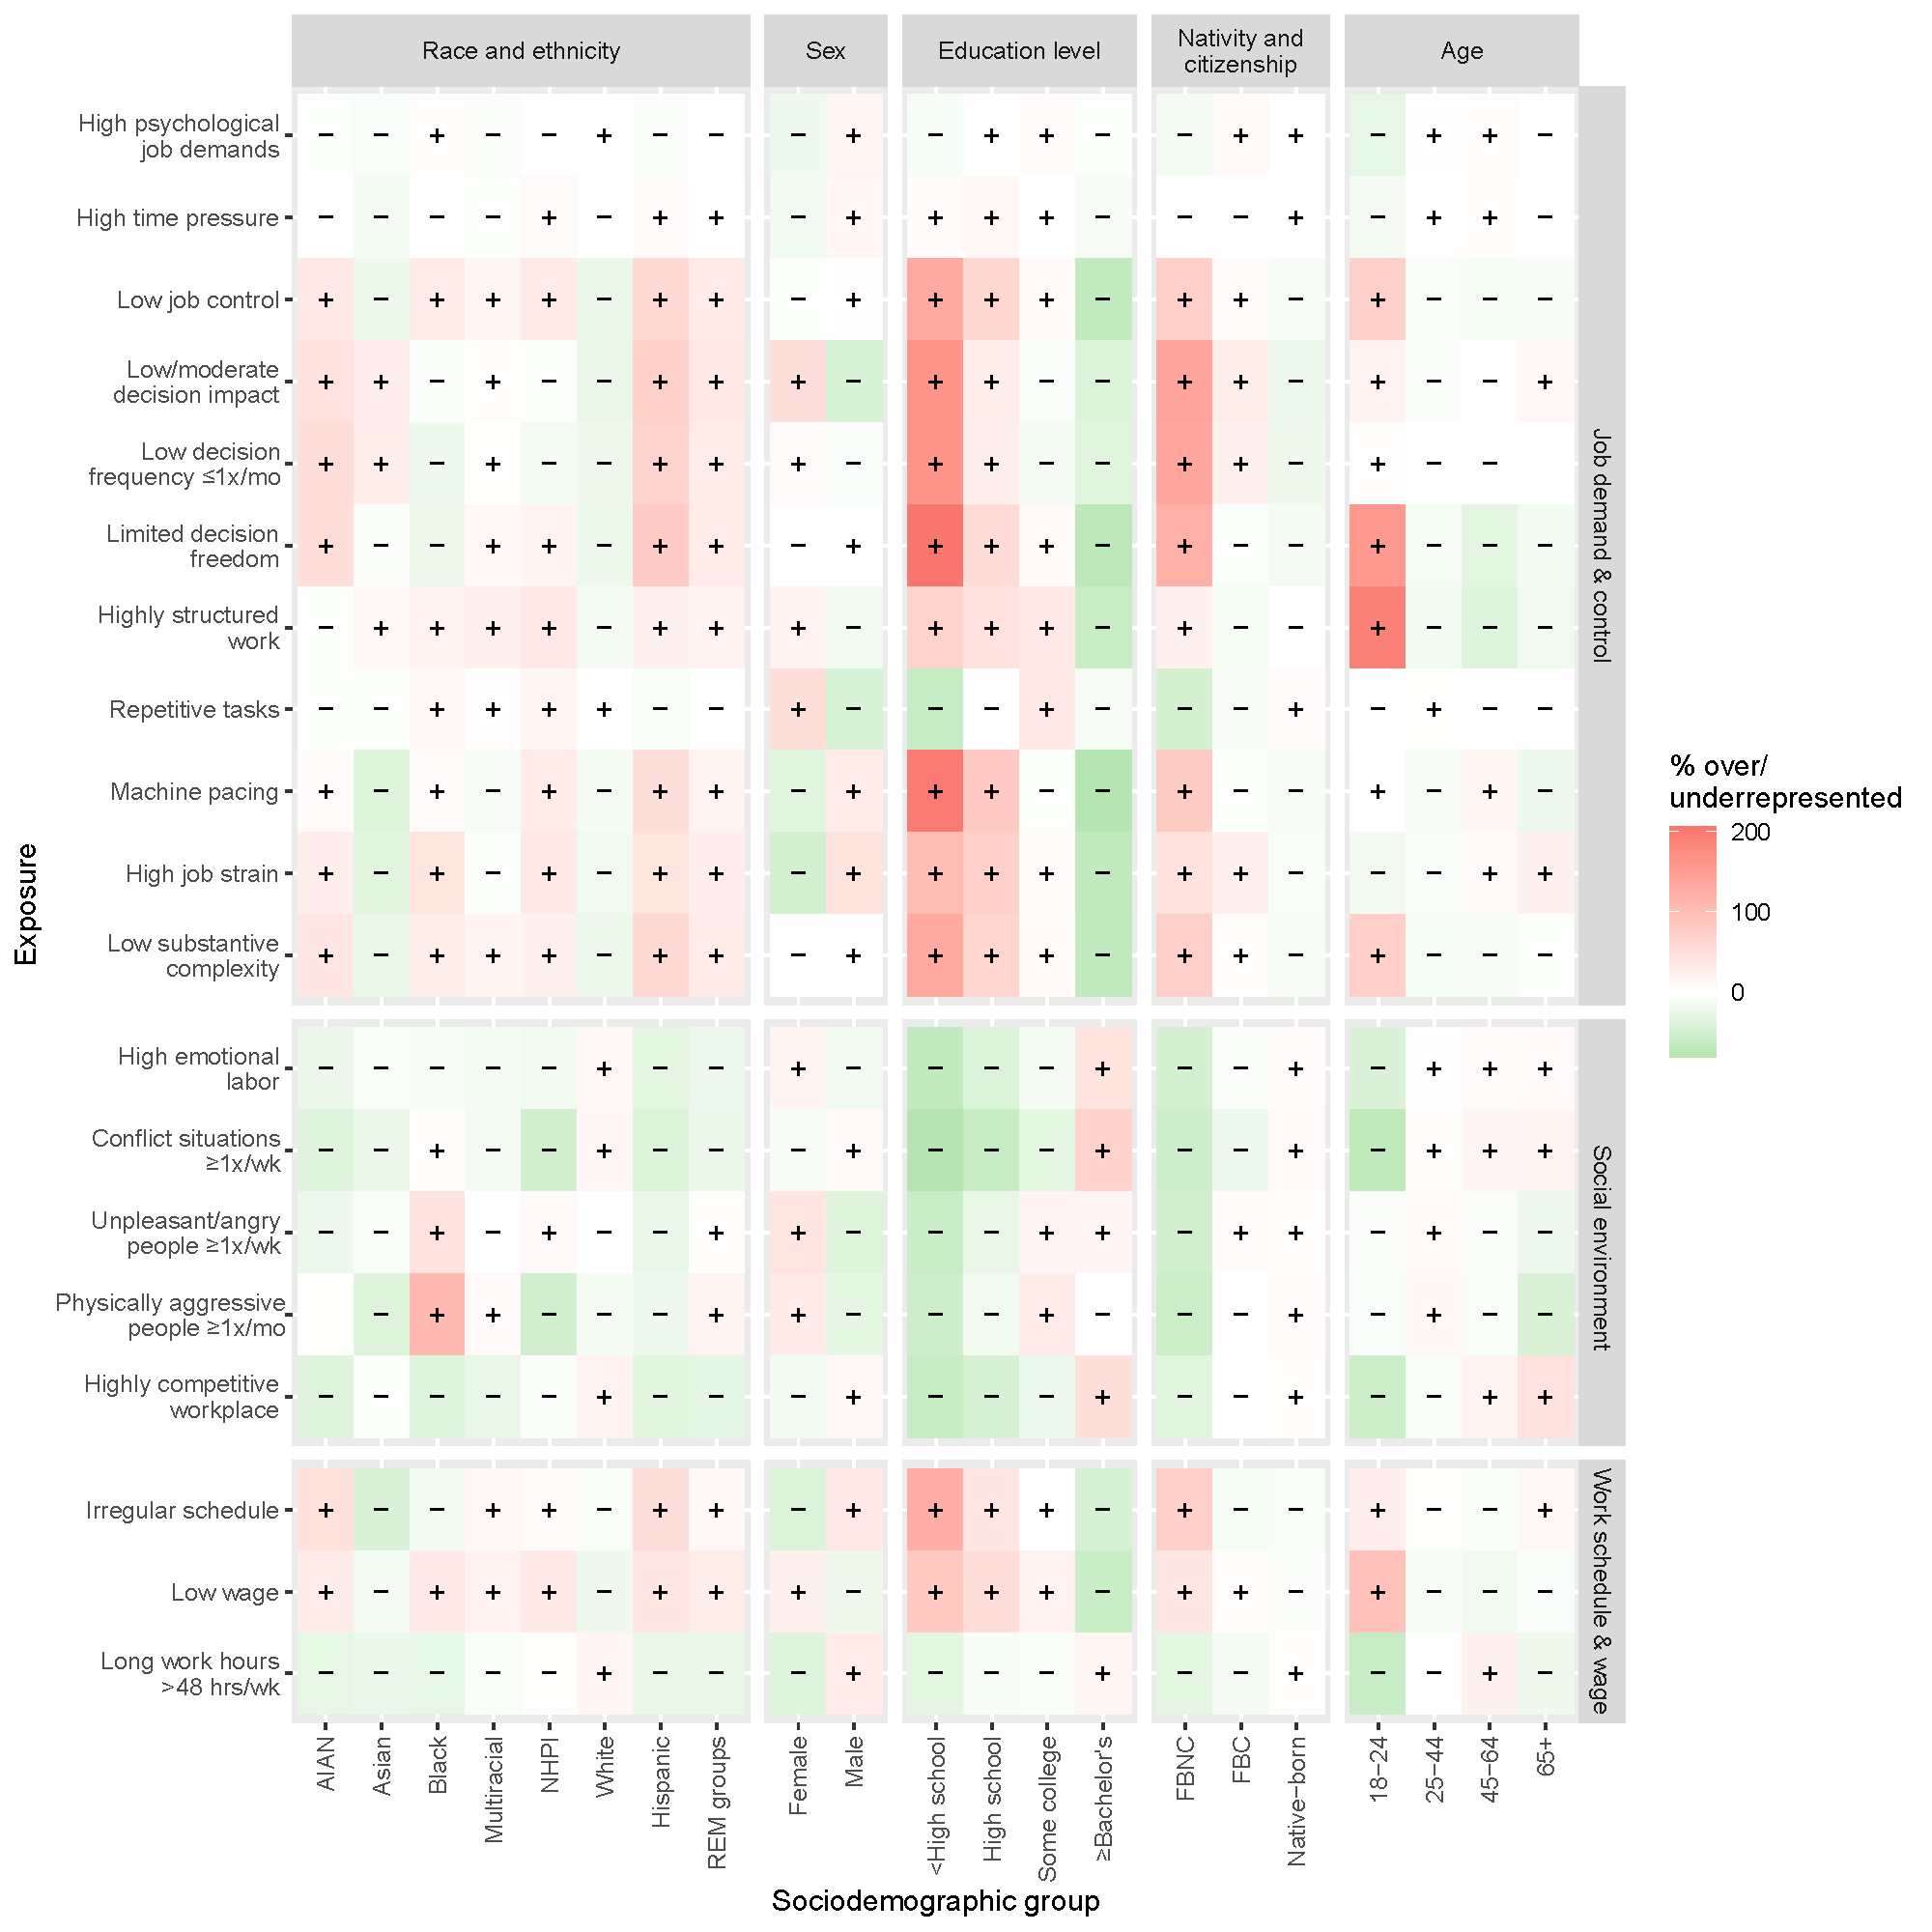
Note.
For all psychosocial exposures except long work hours, the estimates reflect the percent of workers employed in occupations characterized by exposure to these hazards. For long work hours, the estimates reflect the percent of employees exposed to this hazard. Estimates provided for the race and ethnicity categories are non-mutually exclusive. Persons within each race category are of any ethnicity, except for persons who identify as non-Hispanic White, and persons of Hispanic/Latino ethnicity are also counted in their preferred race category. Racial and ethnic minoritized groups include persons identifying as American Indian/Alaska Native, Asian, Black/African American, multiracial, Native Hawaiian/Pacific Islander, or Hispanic/Latino. AIAN = American Indian/Alaska Native, NHPI = Native Hawaiian/Pacific Islander, Black = Black/African American, White = non-Hispanic White, Hispanic = Hispanic/Latino, REM groups = racial and ethnic minoritized groups, <High school = less than high school diploma or equivalent, Some college = some college or associate degree, ≥Bachelor’s = bachelor’s or advanced degree, FBC = foreign-born, citizen, FBNC = foreign-born, noncitizen.
Red/positive (+) value = overrepresented (i.e., the number workers is in excess of the expected based on the group’s share of the total workforce) and are highlighted in red
Green/negative (-) value = underrepresented (i.e., the number of workers is under the expected
Data Sources: Occupational characteristic data were obtained from the Occupational Information Network (O*NET) Resource Center and the Occupational Employement and Wage Statistics (OEWS) survey. US employment estimates, as well as estimates of workers who work long hours, were obtained from the Current Population Survey (CPS) via the Employed Labor Force (ELF) query system.
Citation: Stephan-Recaido S, Peckham T, Hawkins D, & Baker M. OCCUPATIONAL EXPOSURE BURDEN, 2022 [Internet]. 2024. Available: LINK
Page last updated: 1 February 2024
US OCCUPATIONAL EXPOSURE BURDEN ESTIMATES, 2022: PSYCHOSOCIAL, PHYSICAL, & BIOLOGICAL
ABOUT
This dataset was created as part of a study by researchers at the University of Washington, Massachusetts College of Pharmacy and Health Sciences, and Hazardous Waste Management Program in King County. The purpose of this study was to characterize the burden and social distribution of various psychosocial exposures in the US workforce in order to understand the extent of psychosocial exposures in the US, as well as who is most at risk, which important for informing future interventions to improve worker health and reduce health inequities. The full dataset has been provided here for researchers, government employees, occupational health practitioners, and others to use.
This project was led by Marissa Baker, Shelley Stephan-Recaido, Trevor Peckham, and Devan Hawkins.
METHODS AND DATA SOURCES
DATA SOURCES
We merged 2022 US worker demographic data from the Current Population Survey (CPS) via the Employed Labor Force (ELF) query system with occupational survey information from the Occupational Information Network (O*NET). We additionally supplemented our analysis with data from the Occupational Employment and Wage Statistics (OEWS) survey and the CPS to characterize additional psychosocial exposures.
CURRENT POPULATION SURVEY (CPS)
The CPS is a monthly survey of households used to generate employment statistics on the civilian, non-institutionalized labor force in the US. We obtained 2022 employment counts and demographics from the Employed Labor Force (ELF) query system developed by the National Institute for Occupational Safety and Health (NIOSH) Division of Safety Research, which generates estimates based on the CPS. We utilized employment counts by specific occupation for workers 18 years and over and the following sociodemographic groups:
- Race and ethnicity: American Indian or Alaska Native (AIAN); Asian; Black or African American; multiracial; Native Hawaiian or other Pacific Islander (NHPI); White, non-Hispanic; Hispanic or Latino
- Sex: male; female
- Education: less than high school diploma or equivalent (<high school); high school diploma or equivalent (high school); some college or associate degree (some college/associate); bachelor’s or advanced degree (≥bachelor's)
- Nativity and citizenship status: native-born; foreign-born, citizen; foreign-born, noncitizen
- Age: 18 to 24 years (18-24), 25 to 44 years (25-44), 45 to 64 years (45-64), 65 years and over (65+)
These categories represent axes of social and health inequity and allow us to examine how occupational segregation across sociodemographic characteristics may contribute to unequal occupational exposure burdens. For the race and ethnicity categories, persons within each race category are of any ethnicity, except for persons who identify as non-Hispanic White, and persons of Hispanic/Latino ethnicity are also counted in their preferred race category. Consequently, estimates provided for the race and ethnicity categories are non-mutually exclusive. The category for racial and ethnic minoritized groups represent American Indian or Alaska Native, Asian, Black or African American, multiracial, Native Hawaiian or other Pacific Islander, and Hispanic or Latino workers. We additionally obtained employment counts by hours worked, occupation code, and sociodemographic group to inform the number of workers exposed to long work hours (>48 hours per week).
THE OCCUPATIONAL INFORMATION NETWORK (O*NET)
O*NET is a public-use database of job characteristics developed under the United States Department of Labor/Employment and Training Administration. O*NET contains detailed occupational characteristic information, including skills needed, tasks performed, work conditions, and other pertinent job characteristics, for hundreds of standardized occupations covering the majority of the US economy. We utilized data from 55 O*NET elements in the O*NET 27.2 Database, released in February 2023, to characterize 17 psychosocial exposures, 6 physical exposures, 6 ergonomic exposures, 8 safety exposures, 3 chemical exposures, and 3 biological exposures in the workplace. Additional details of the O*NET elements utilized are described in the EXPOSURE DEFINTIONS seciton below. Further information on the O*NET methodology and data collection strategy can be found in the O*NET Resource Center.
OCCUPATIONAL EMPLOYMENT AND WAGE STATISTICS (OEWS) SURVEY
The US BLS OEWS survey is a semi-annual mail survey of non-farm establishments that produces employment and wage statistics for over 800 occupations in the U.S. Employment and wage estimates are based on six panels of survey data collected over a 3-year period. We utilized May 2022 survey estimates to inform which Census occupations are low-wage, as well as to assign employment estimates to O*NET occupations for weighting purposes.
ANALYTIC APPROACH
ESTIMATES OF EXPOSURE BURDEN
For O*NET- and OEWS-informed exposures, all workers within an occupation were considered to exposed if the average score for that occupation was at or above the pre-defined exposure threshold. However, if the score was below the exposure threshold, no workers within that occupation were considered to be exposed. We summed the number of workers employed across all occupations where exposure is expected to occur to obtain the total number of workers exposed. For the ELF-CPS-informed exposure (long work hours), we obtained the estimated number of workers exposed to long work hours by occupation and for all occupations combined directly from the ELF query system; that is, for this measure, we obtained the number of workers exposed for each occupation, rather than a binary not/exposed determination for all other measures. For all exposures, we then divided the total number of workers defined as exposed by the total number of workers included in our dataset to obtain the overall percent of workers exposed. Burden estimates were calculated for all workers and separately for each sociodemographic group.
ESTIMATES OF EXPOSURE DISPROPORTIONALITY
Estimates of exposure disproportionality were calculated by finding the absolute and relative difference between the estimated number of workers of a particular sociodemographic group defined as exposed and the number of workers expected to be exposed based on that group’s overall proportion in the total workforce. These estimates reflect the extent to which sociodemographic groups are over- or underrepresented in exposure burden. We considered a group to be overrepresented if the estimated number of exposed workers of a particular sociodemographic group was in excess of the expected value.
LIMITATIONS
There are some limitations to note, which are important for the interpretation of our study results.
- Bias: The O*NET-informed exposures were based on analyst, occupational expert, and job incumbent responses to subjective questionnaires and are therefore subject to bias.
- Coverage of workforce: The CPS excludes military personnel and institutionalized workers from its survey, so these populations are not covered in this analysis.
- Coverage of exposures: This analysis does not include all relevant psychosocial, physical, ergonomic, safety, and biological exposures. This analysis only includes those exposures in which could be informed by O*NET, OEWS, or CPS. Coverage of chemical exposure are provided in a separate analysis here.
- Sociodemographic information: This analysis is limited to the sociodemographic characteristics captured in the CPS. In addition, this analysis does not examine intersecting identities.
- Misclassification: Exposure information was only available at the occupation-level for our O*NET- and OEWS-informed exposures. We thus assumed the same exposure for all individuals within a single occupation and were unable to account for the variability of exposures across individuals or groups within the same occupation. Consequently, disparities in exposure estimated in this study can only be attributed to occupational segregation, i.e., the uneven distribution of working populations across occupations, and not differential exposure within an occupation. Use of crosswalks required to merge the datasets could have also introduced some misclassification. It is important to note that the ELF-CPS-informed exposure (long work hours) was not subject to these same limitations, since these estimates are based on worker-level data.
- Validity: O*NET’s primary purpose is to understand worker and job requirements of different occupations for use by students, job seekers, employers, government agencies, and researchers, and its validity as a source of exposure assessment information is not clear. While several studies have demonstrated the predictive validity (e.g., the ability to predict an outcome) of certain O*NET elements, only a few have evaluated their convergent validity (e.g., the degree to which one measure relates to another measure of the same construct; Cifuentes et al., 2010; Cifuentes et al., 2007; Meyer et al., 2011; Fujishiro and Koessler, 2020). One such study found that O*NET may more accurately capture the job experience of non-Hispanic White workers than workers from REM groups (Fujishiro and Koessler, 2020), which suggests experiences or exposures of other groups of workers may be differentially captured in O*NET as well.
References:
Cifuentes M, Boyer J, Gore R, et al. Inter-method agreement between O*NET and survey measures of psychosocial exposure among healthcare industry employees. Am J Ind Med. 2007;50(7):545-553.
Cifuentes M, Boyer J, Lombardi DA, Punnett L. Use of O* NET as a job exposure matrix: a literature review. Am J Ind Med. 2010;53(9):898-914.
Fujishiro K, Koessler F. Comparing self-reported and O*NET-based assessments of job control as predictors of self-rated health for non-Hispanic whites and racial/ethnic minorities. PLoS One. 2020;15(8):e0237026.
Meyer JD, Cifuentes M, Warren N. Association of self-rated physical health and incident hypertension with O*NET factors: validation using a representative national survey. J Occup Environ Med. 2011;53(2):139-145.
GENERAL DEFINITIONS
Overrepresentation:
Overrepresentation occurs when the number of workers of a particular sociodemographic group exceeds the number of workers expected based on their overall proportion of the total workforce (e.g., workers identifying as Hispanic/Latino compose 18% of the overall US workforce, but 34% of the workforce in jobs with little decision making freedom. They are therefore overrepresented in jobs with little decision making freedom.)
Other exposures:
Other exposures include physical, ergonomic, safety, and biological hazards.
Racial and ethnic minoritized group:
Racial and ethnic minoritized groups include persons who identify as American Indian or Alaska Native, Asian, Black or African American, multiracial, Native Hawaiian or other Pacific Islander, or Hispanic or Latino.
Sociodemographic group:
A specific population defined by a combination of social and demographic factors. Here, we looked at the following sociodemographic groups as defined by race and ethnicity, sex, educational attainment, nativity and citizenship status, and age.
EXPOSURE DEFINITIONS
The table below describes each of the exposures presented in the dataset, including a description of the exposure, its data source, and its exposure threshold definition. The exposure threshold definition is intended to represent a high level of exposure.
Notes. CPS = Current Population Survey; ELF = Employed Labor Force; OEWS = Occupational Employment and Wage Statistics; O*NET = Occupational Information Network.
References:
Cifuentes M, Boyer J, Gore R, et al. Inter-method agreement between O*NET and survey measures of psychosocial exposure among healthcare industry employees. Am J Ind Med. 2007;50(7):545-553.
de Castro AB, Agnew J, Fitzgerald ST. Emotional Labor: Relevant Theory for Occupational Health Practice in Post-Industrial America. AAOHN J. 2004;52(3):109-115.
Fujishiro K, Koessler F. Comparing self-reported and O*NET-based assessments of job control as predictors of self-rated health for non-Hispanic whites and racial/ethnic minorities. PLoS One. 2020;15(8):e0237026.
Fujishiro K, MacDonald LA, Crowe M, McClure LA, Howard VJ, Wadley VG. The role of occupation in explaining cognitive functioning in later life: Education and occupational complexity in a US national sample of black and white men and women. J Gerontol B Psychol Sci Soc Sci. 2019;74(7):1189-1199.
Karasek RA. Job Demands, Job Decision Latitude, and Mental Strain: Implications for Job Redesign. Adm Sci Q. 1979;24(2):285-308.
Kohn ML, Schooler C. The Reciprocal Effects of the Substantive Complexity of Work and Intellectual Flexibility: A Longitudinal Assessment. Am J Sociol. 1978;84(1):24-52
Meyer JD, Cifuentes M, Warren N. Association of self-rated physical health and incident hypertension with O*NET factors: validation using a representative national survey. J Occup Environ Med. 2011;53(2):139-145.
PUBLICATIONS
FUNDING SOURCES
CONTACT INFORMATION
Please contact Marissa Baker at bakermg@uw.edu for any questions.
Citation: Stephan-Recaido S, Peckham T, Hawkins D, & Baker M. OCCUPATIONAL EXPOSURE BURDEN, 2022 [Internet]. 2024. Available: LINK
Page last updated: 1 February 2024